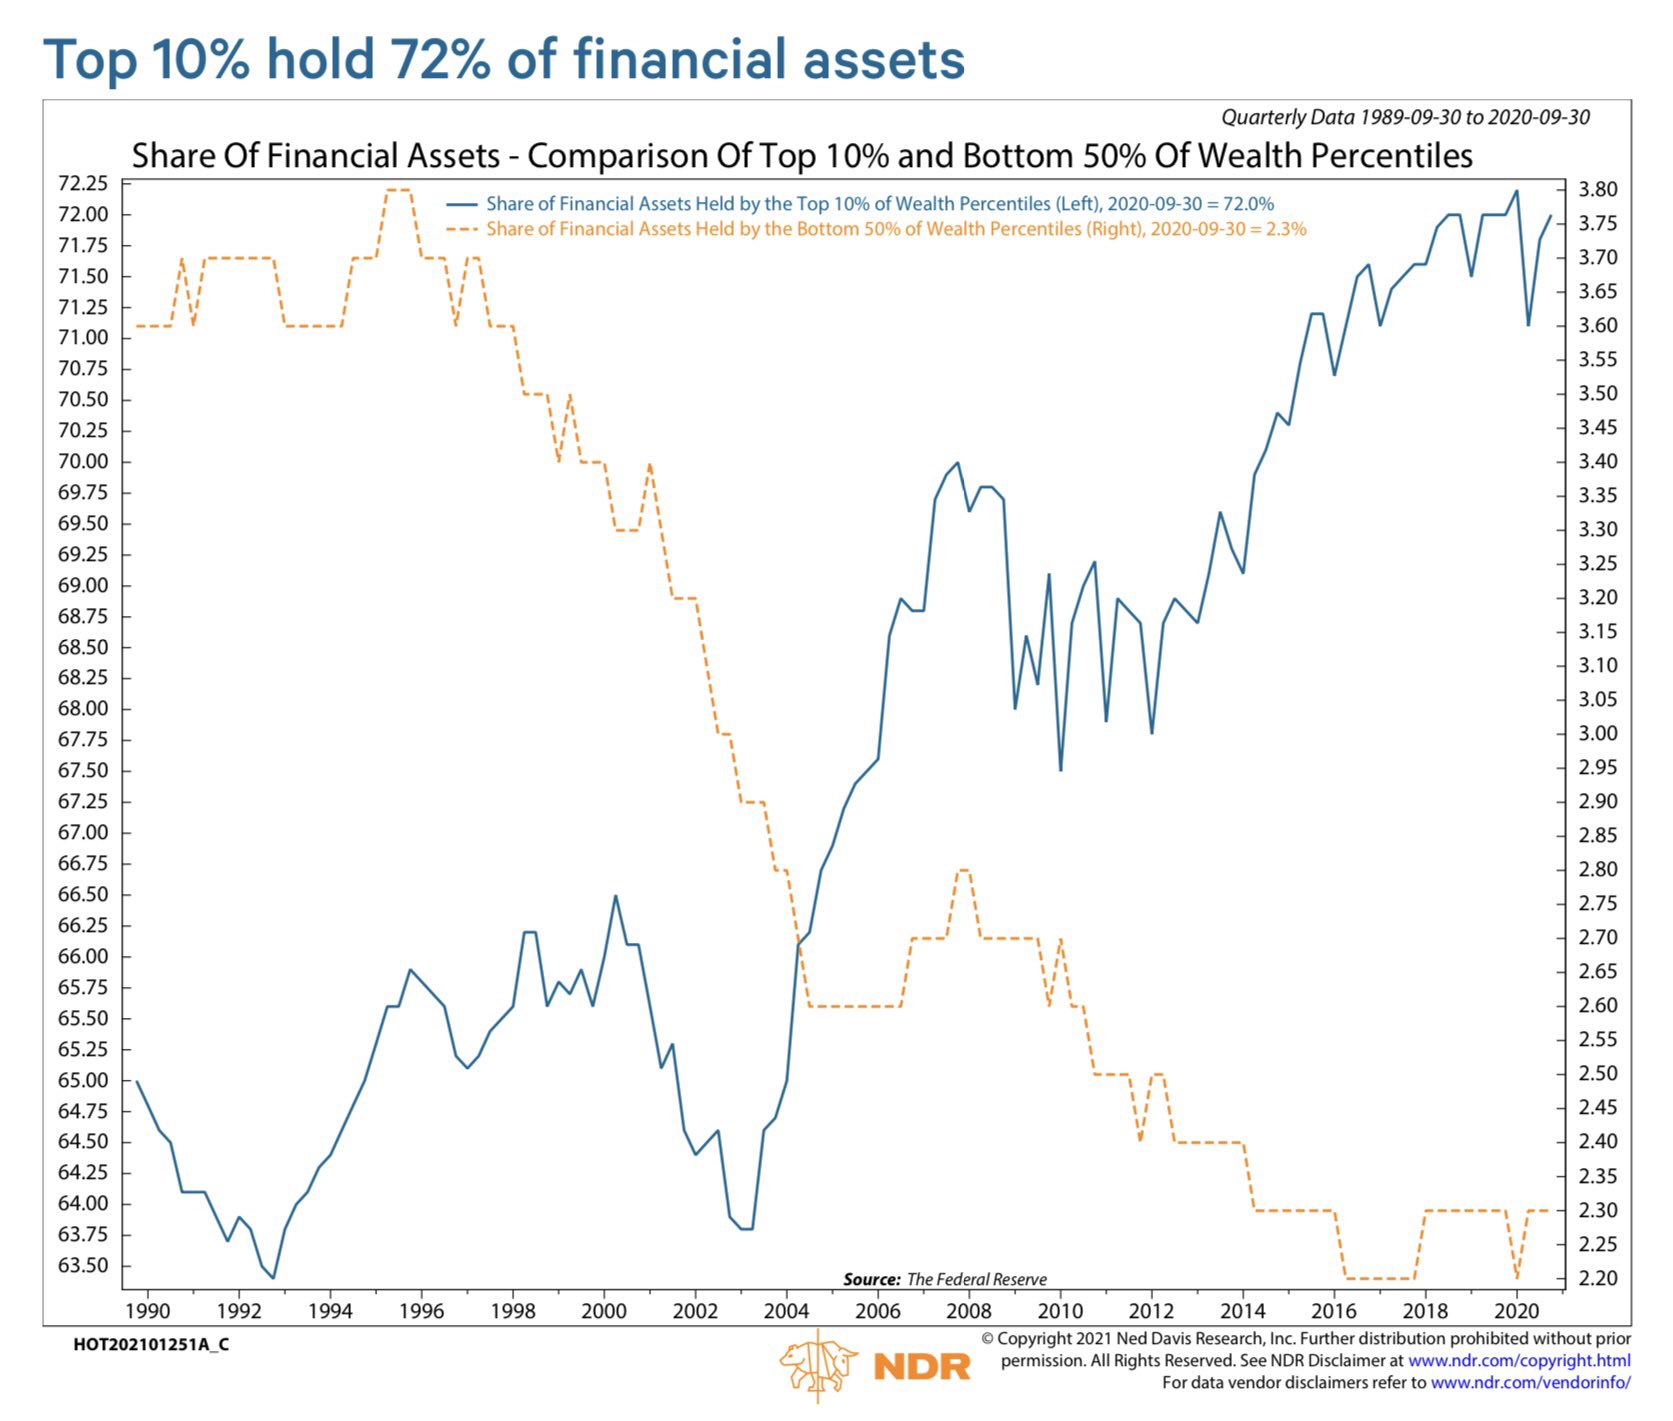
Here is an example of a K-shaped chart for you. This shows the long time divergence of the amount of financial assets held by the top 10% versus those held by the bottom 50% of wealth percentiles.
The graph has different axes, so sit and look at it for a while. In a nutshell, the share of financial assets held by the bottom 50% has declined from 71% in 1989 to 2.3% in 2020.
For some historical context on the concentration of wealth, you might consider reading Will and Ariel Durrant’s The Lessons of History. They have a highly pertinent summary of the concentration of wealth in their chapter on economics and history. Here is what they think drives wealth inequality.
Since practical ability differs from person to person, the majority of such abilities, in nearly all societies, is gathered in a minority of men. The concentration of wealth is a natural result of this concentration of ability, and regularly recurs in history. The rate of concentration varies (other factors being equal) with the economic freedom permitted by morals and laws. Despotism may for a time retard the concentration; democracy, allowing the most liberty, accelerates it.
p. 55, The Lessons of History. 1968.
Graph source: Ned Davis Research, via Twitter.
For more great dinks articles, read these:
Building Wealth On $600 Per Month
Save, Invest and Reinvest To Build Wealth
Wealth Building Is A Team Sport


No Comments yet!